As part of this three person Human - Computer Interaction research project, I
Was trained on submitting proposals to the Institutional Review Board (IRB).
Conducted an extensive literature review on Google Scholar.
Coded and organized qualitative data from 50 academic articles.
Created a user survey. Defined Likert-scale and short form questions.
Collected survey responses on Prolific and Discord.
Performed statistical analysis of results in R. Ran contingency tables and pairwise comparison, created code book.
Wrote research paper in LaTeX using Overleaf.
Submitted paper for publication, published in the International Journal on Computer Science and Information Systems in 2021.
Background
Academic research containing human subjects requires a standardized method of categorizing study participants into demographic labels for accurate analysis of results. Standard demographics include age, gender, ethnicity, or income.
Video games are a popular topic in academic research. The demographic label that researchers commonly use for video game subjects is gamer skill category (ex. "Expert Gamer").
Problem
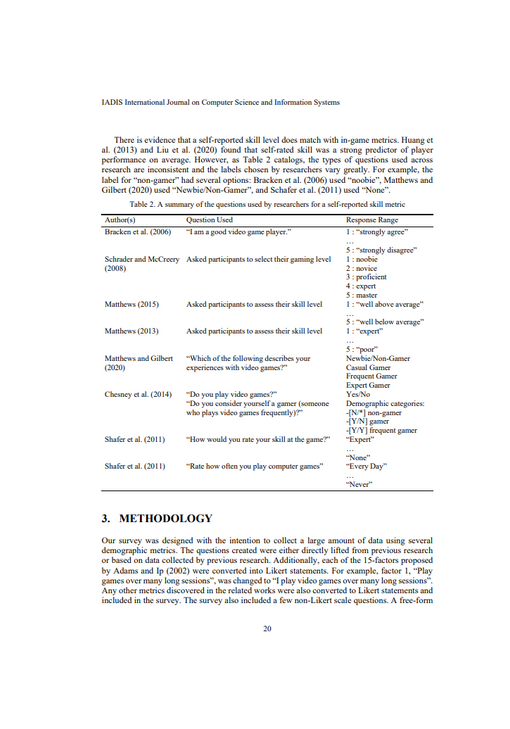
There is no standardized or objective consensus on the definition of gamer skill categories.
Some researchers define "Expert Gamers" as playing more than a set number of hours per week, though that number differs between each study. The inconsistency in terminology makes comparison between research works impossible.
Goal
Determine which metric(s) provides a consistent, accurate representation of gamer skill category through examining existing literature and conducting user study.

Research Questions
-
Is there a consensus for the metric of hours per week used to define gaming skill categories?
-
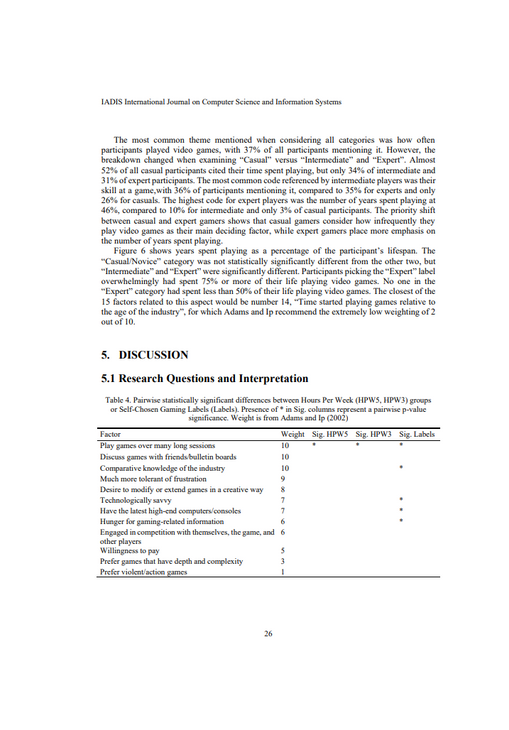
With what factors does hours per week correlate?
-
With what factors do other metrics, used by previous research, correlate?
-
What is the most reliable metric for dividing participants into gaming skill categories?
The survey was separated into four sections:
Identification section and obtained participant’s consent. A multiple-choice question allowed participants to select a self-assigned label out of five categories: Expert Gamer, Intermediate Gamer, Casual Gamer, Novice Gamer, or Non-Gamer.
25 questions that were measured on a 5-point Likert scale.
Questions about the participants’ typical gaming behaviour and preferences such as their preferred genre and the number of hours spent playing video games.
Page obtaining demographic information.
Statistical Analyses & Visualizations
Software used: R.
P-value significance threshold: 0.05.
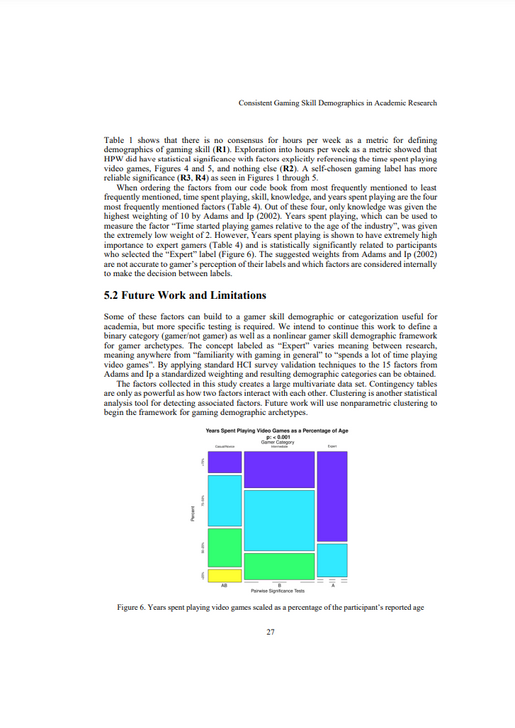
Contingency tables were used for visualization of patterns in the data.
Contingency tables use proportional rectangles to represent numerical summations within a group.
-
The wider a column, the more participants fell into those subdivision of categories.
-
The taller a block within a column, the more participants who answered with that value.
These blocks are also color-coded to assist in readability.


Results
-
There is no consensus for hours per week as a metric for defining demographics of gaming skill.
-
Exploration into hours per week as a metric showed that HPW did have statistical significance with factors explicitly referencing the time spent playing video games, Figures 4 and 5, and nothing else.
-
A self-chosen gaming label has more reliable significance.
LaTeX, Overleaf: Writing The Academic Article
Software used: LaTeX document preparation system, Overleaf Editor
The team and I compiled all of our analyses and data visualizations in a final academic article. For ease of formatting and exporting, we used the LaTeX on the Overleaf Editor.
%20(8).png)
Academic Publishing
Software used: LaTeX document preparation system, Overleaf Editor
We submitted the article for publication to several journals. In August 2022, it was selected for publication in the IADIS International Journal on Computer Science & Information Systems. It was presented at the 16th International Conference on Game & Entertainment Technologies in July 2023.
Reflections
This was my third experience with academic research, and one of the most enjoyable.
It was a fulfilling experience because I developed a wide range of skills, from conducting literature reviews to designing user surveys to conducting data analysis and visualizations to scientific writing and communication. I gained a deeper appreciation for the work that service designers and user researchers do; the empathy - building and user feedback are crucial for product design teams to bring ideas into reality.


